Dashboards, analytics and reports
Dashboards, analytics and reports
See the plant, prove the response
Live dashboards show the plant right now; the analytics workbench and scheduled reports turn a month of incidents into something you can hand to management.
Real-time dashboards
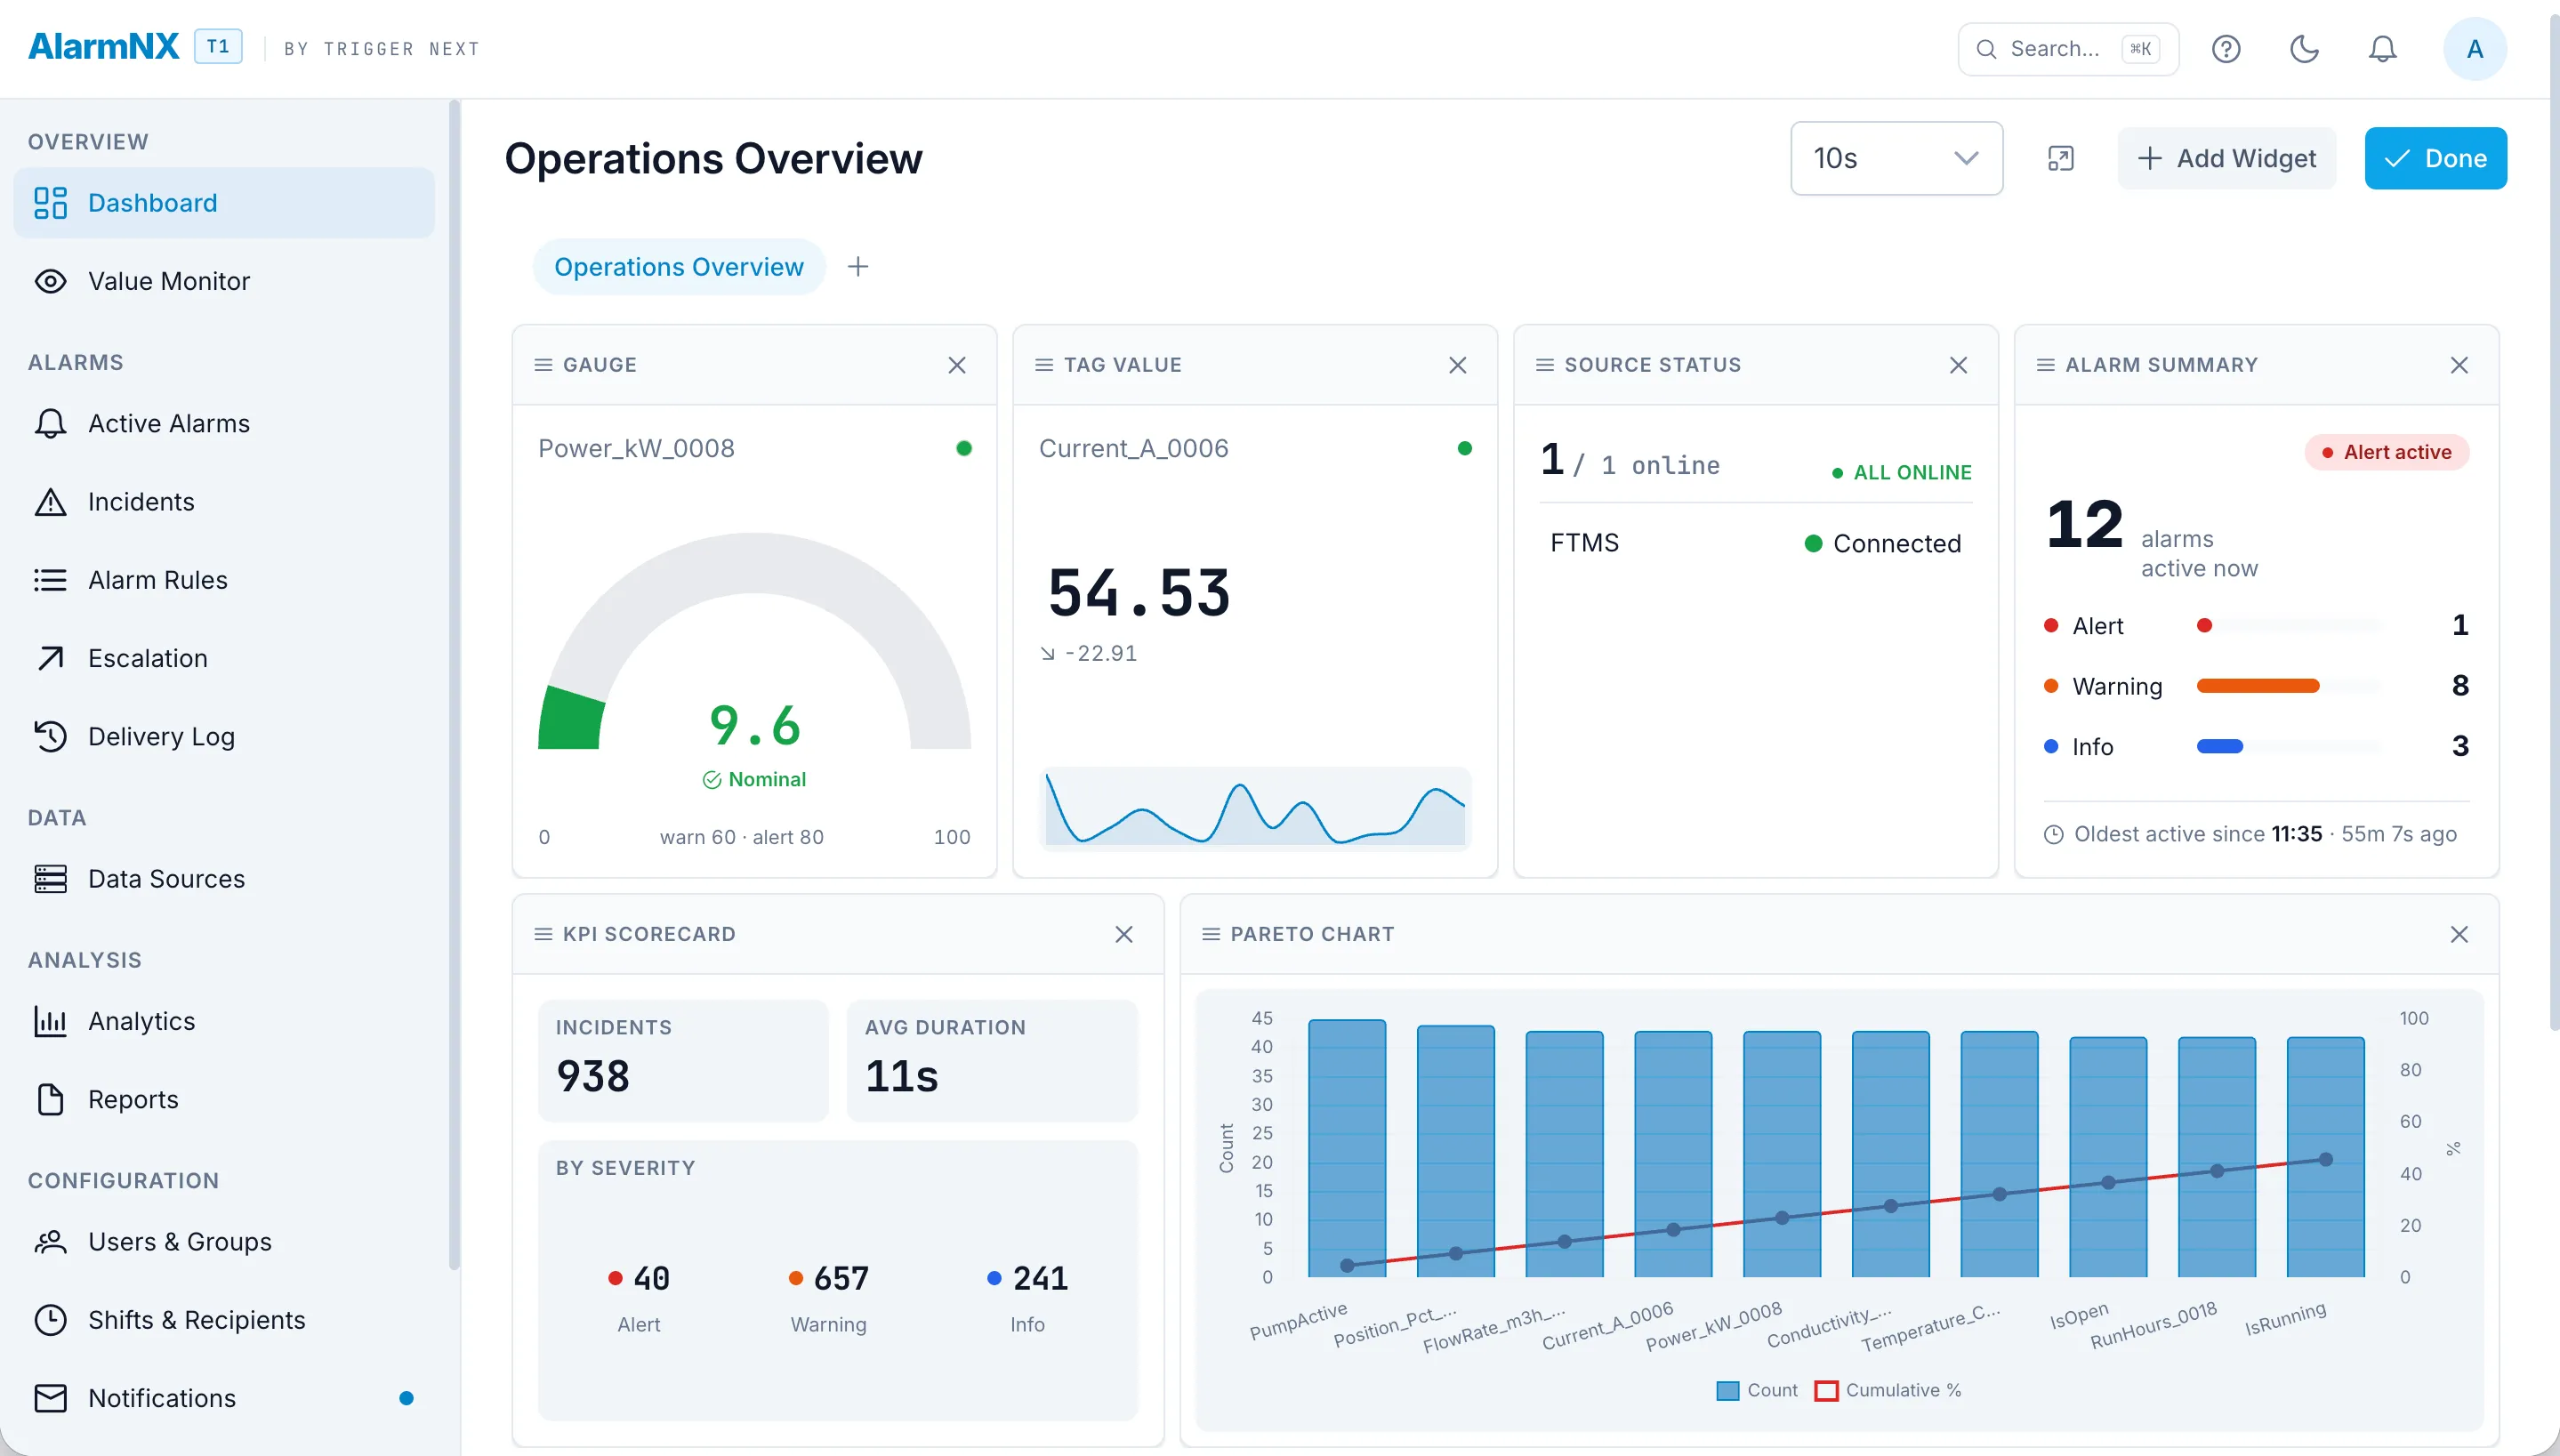
Build a dashboard from drag-and-drop widgets and arrange it the way your team reads the plant. Widgets show live tag values as they update, so the board is a current picture rather than a snapshot. Each user can keep several dashboards on their own tabs, one for the overview and others for the areas they own.
- Drag-and-drop widgets you arrange yourself.
- Live tag values that update in place.
- Multiple dashboards on per-user tabs.
Analytics workbench
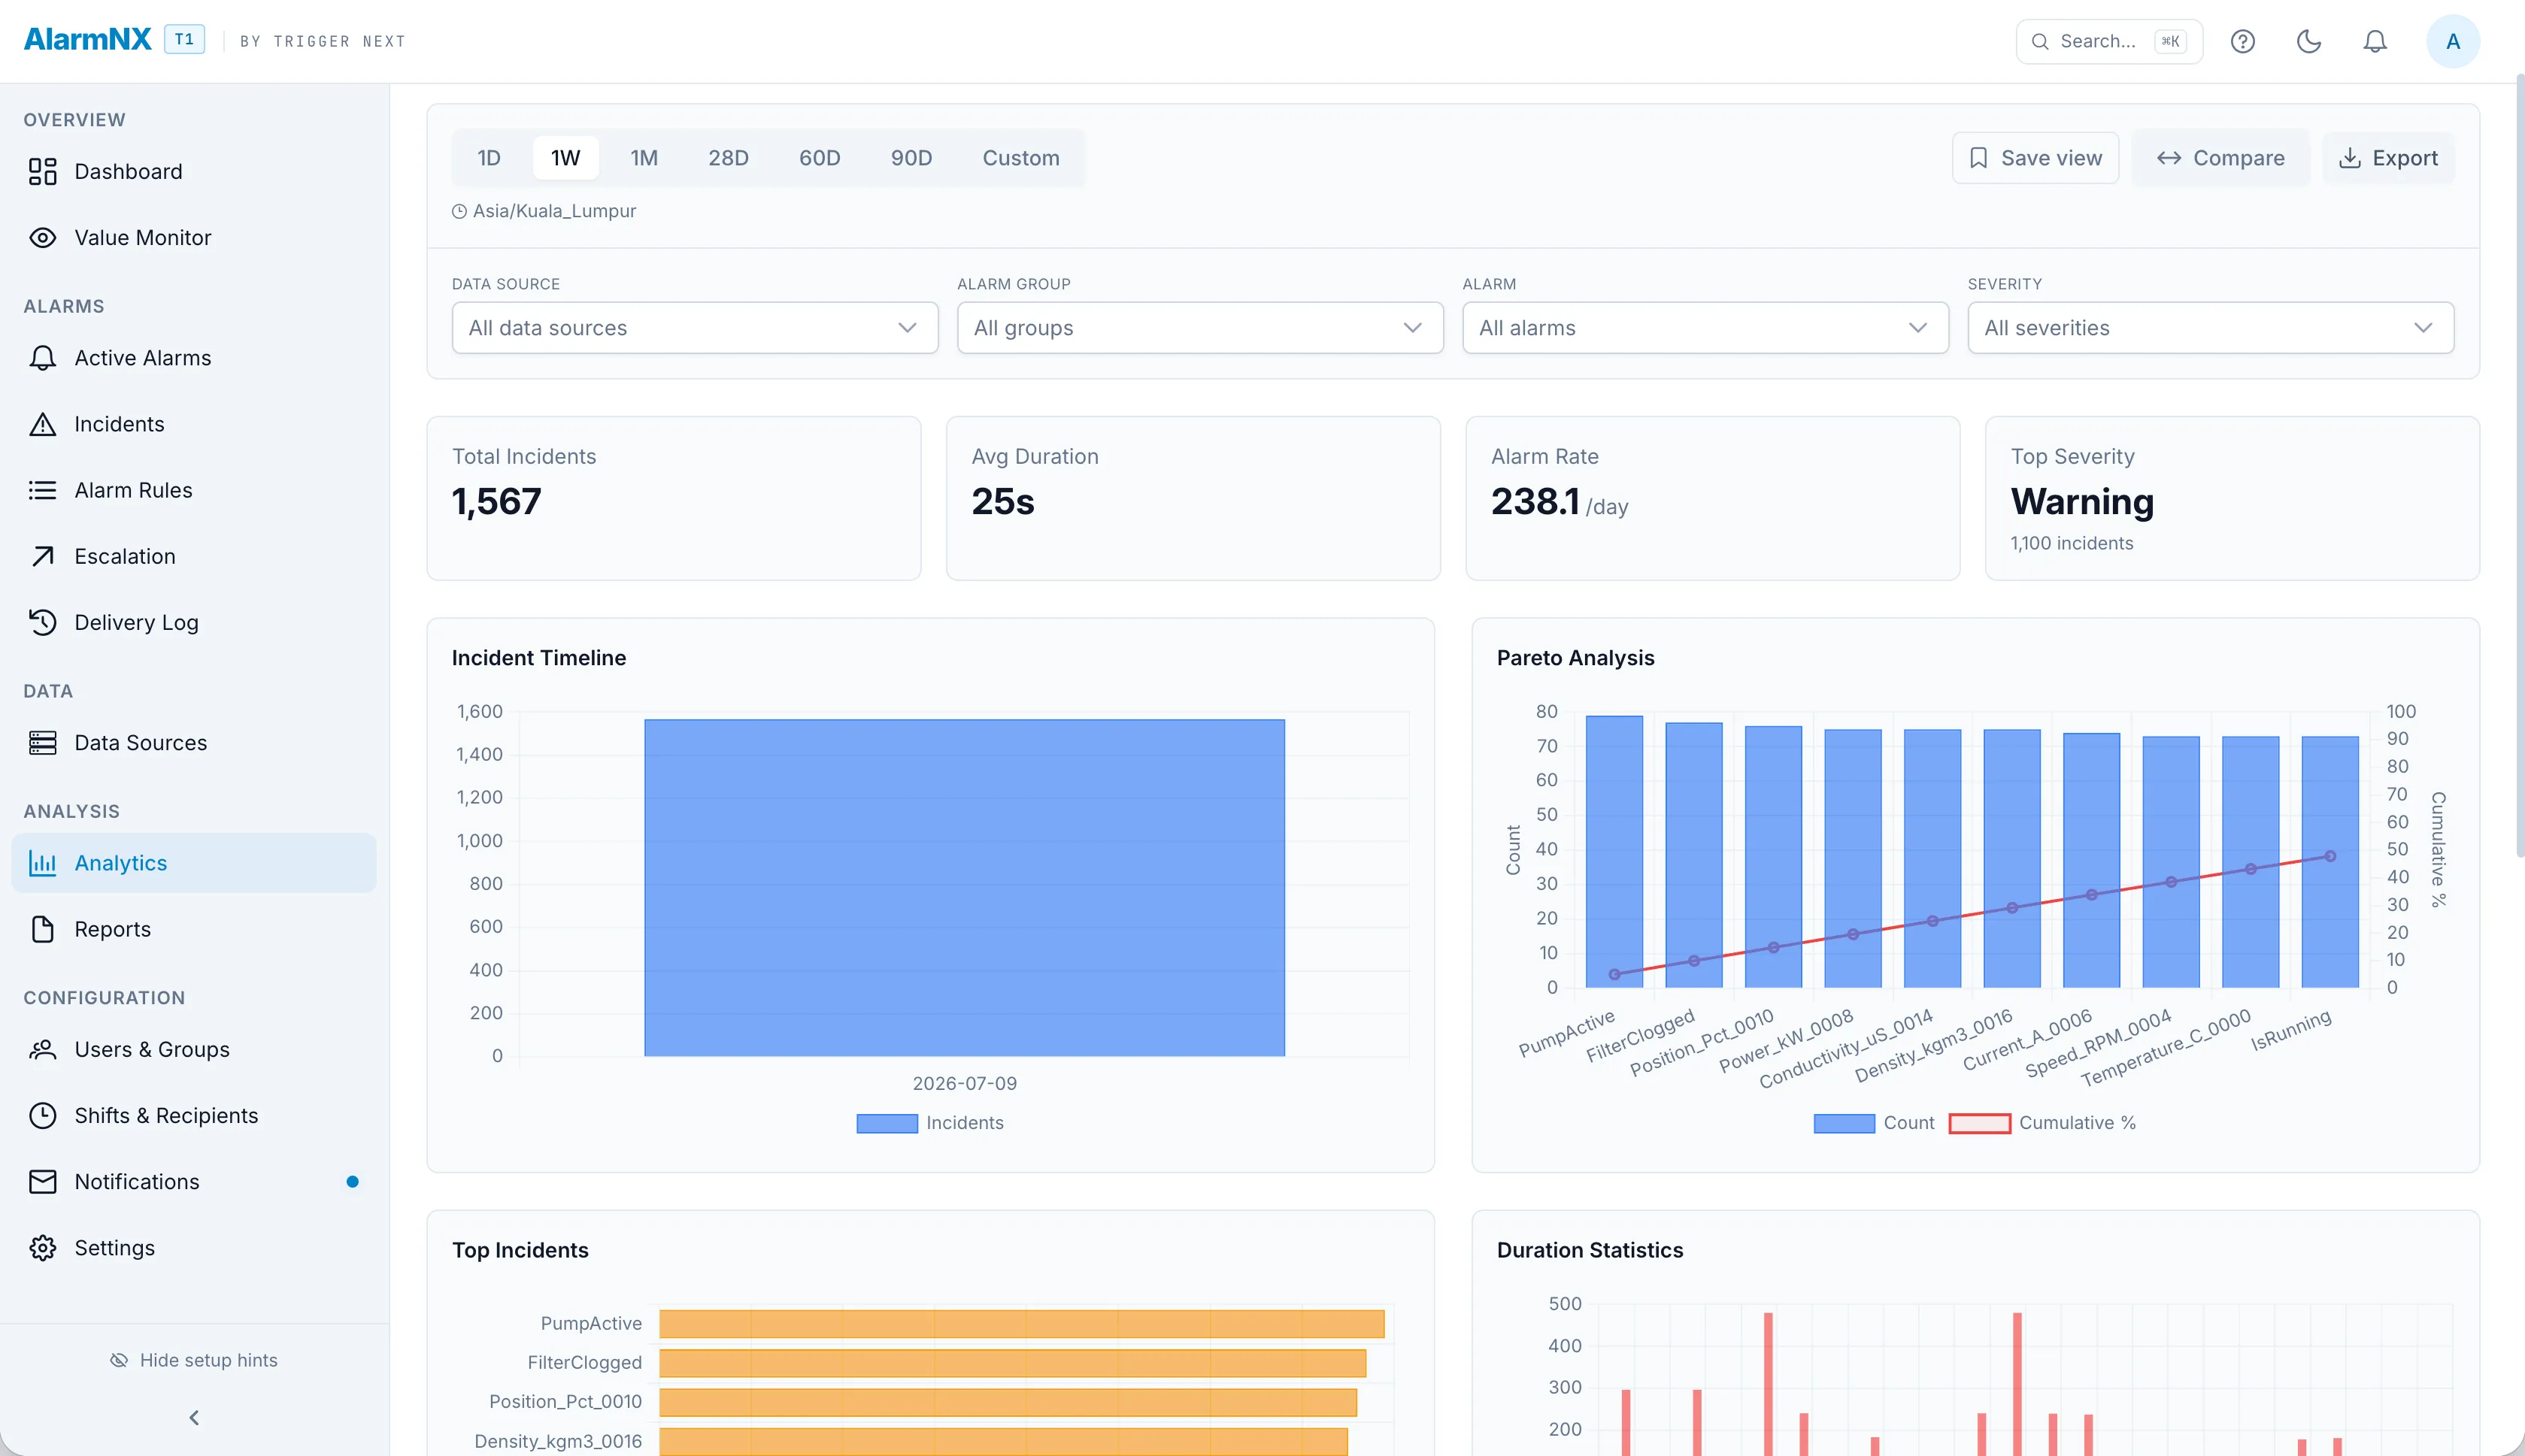
Move from what is happening now to what keeps happening. A Pareto chart ranks the alarms that cost you the most attention, heatmaps show when they cluster, and KPI cards summarize the period at a glance. Response metrics including MTTA and MTTR put a number on how quickly the team acknowledges and resolves, so you can see whether a change actually helped.
- Pareto of the alarms that demand the most attention.
- Heatmaps that show when alarms cluster.
- KPI cards summarizing the period.
- MTTA and MTTR for acknowledgment and resolution.
Value monitor and trends
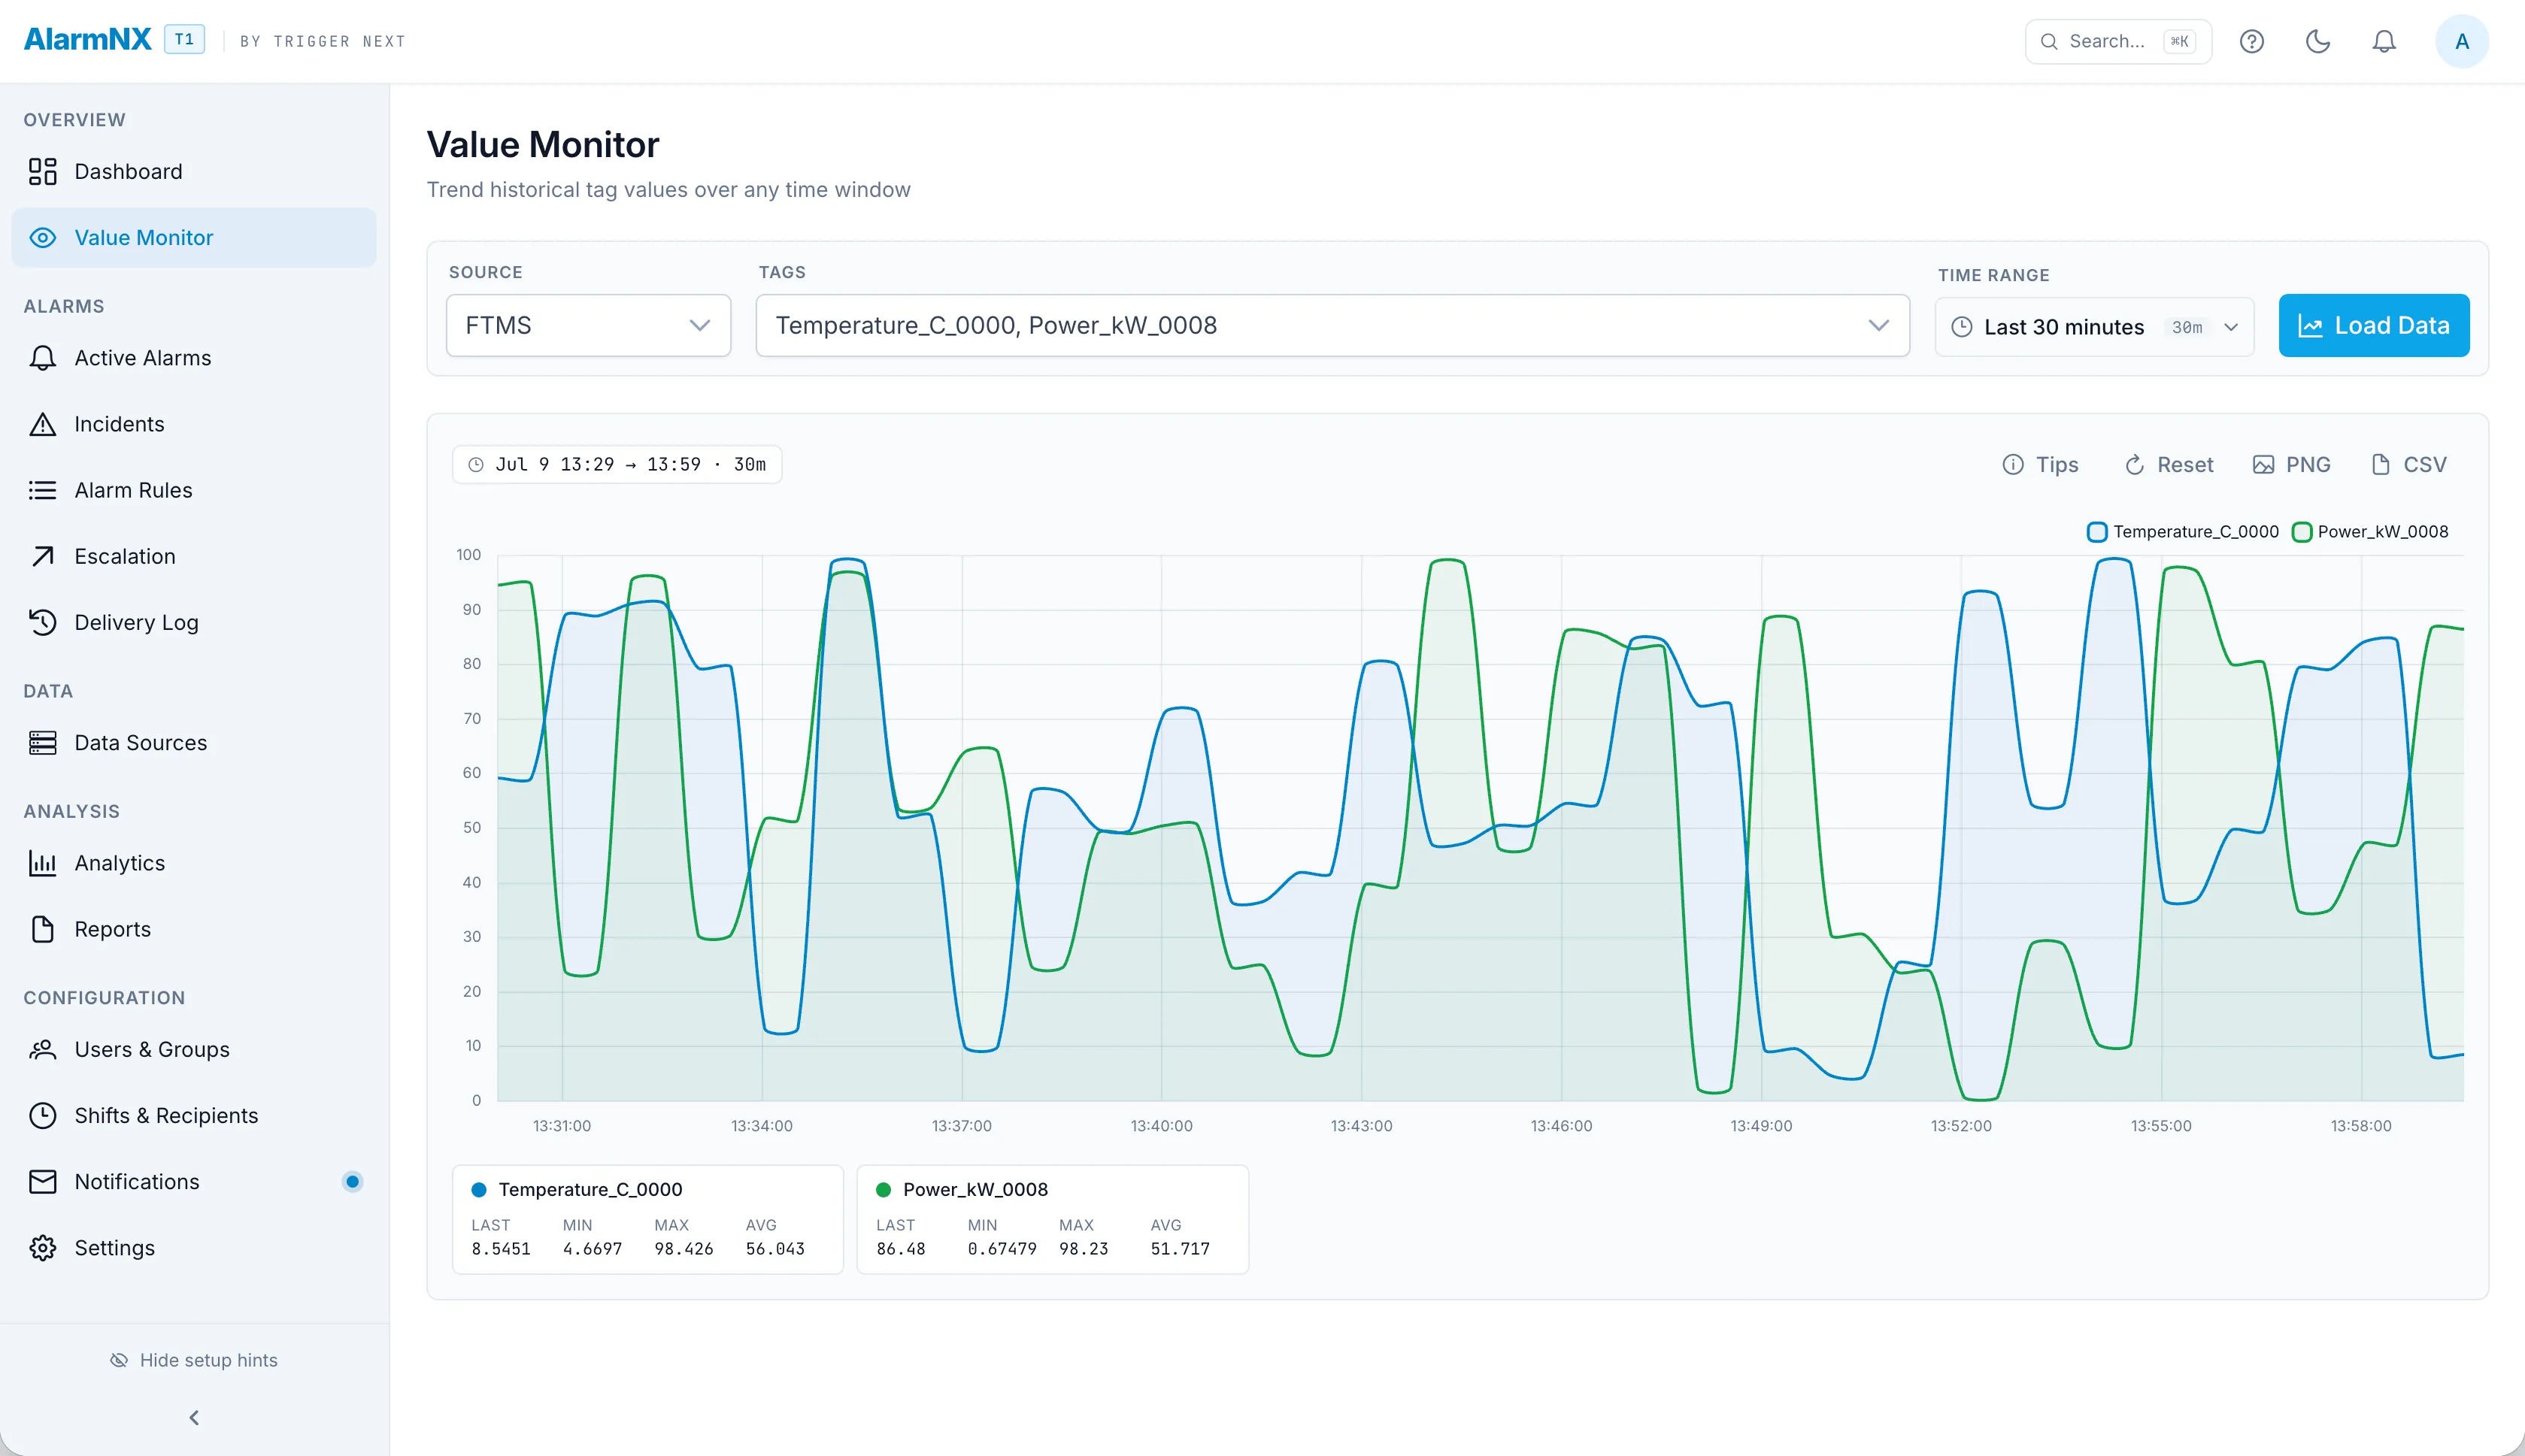
Every monitored tag is stored as a time series, so you can look back over a history and not just a current reading. Charts downsample long ranges so a year of data still draws quickly and stays readable, while an XLSX export gives you the underlying values at full fidelity for your own analysis.
- Time-series history for every monitored tag.
- Downsampled charting that stays readable over long ranges.
- XLSX export at full fidelity.
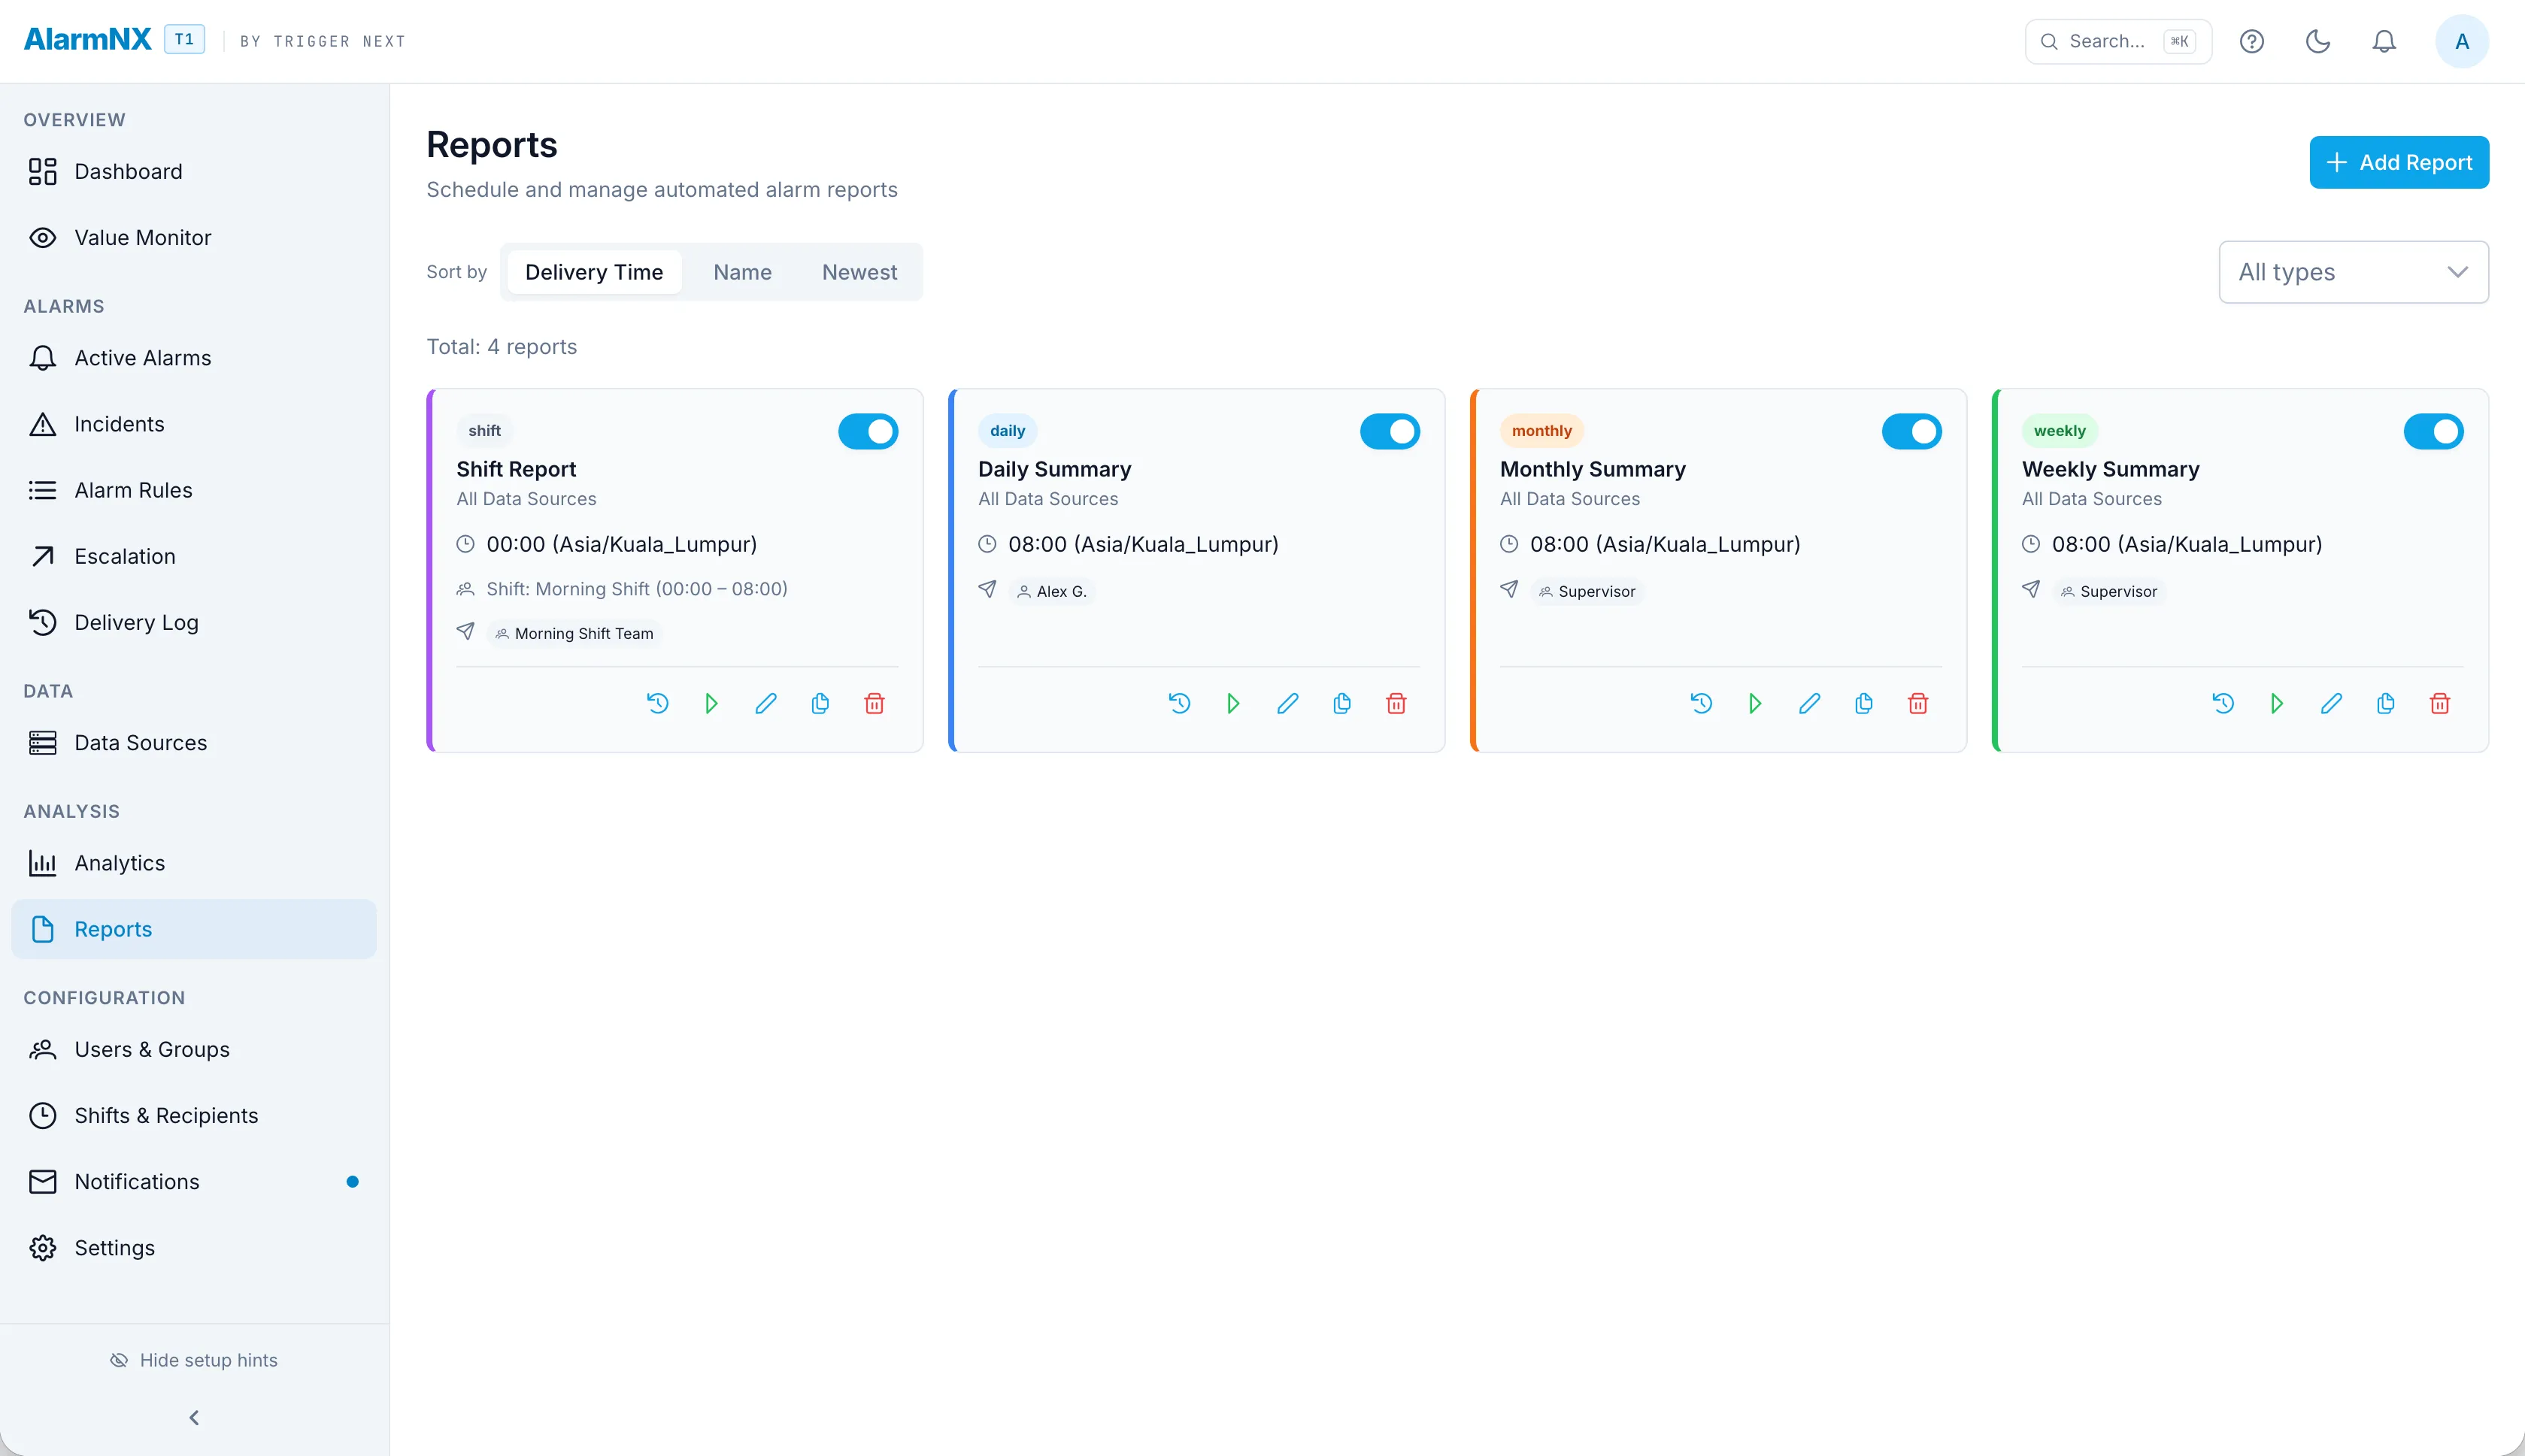
Scheduled reports
Reporting should not depend on someone remembering to run it. Schedule a report and AlarmNX renders it to PDF and sends it on the same channels it uses for alarms, so the weekly summary arrives by email or chat without anyone lifting a finger. Reports carry your site letterhead, so they are ready to forward to management.
- PDF reports rendered on a schedule.
- Delivered over the same channels as alarms.
- Site letterhead for management.